
You can use Window's built-in Resource Monitor to help debug your live Applications.
Whereas the Processes tab of the Task Manager will give you a simplified list of the processes running on your machine, the resource monitor will provide a detailed account of the resources your processes are consuming. This includes a memory footprint and list of referenced DLLs/files, which can be useful if you are trying to resolve dependency issues in a live environment.
When used alongside other development tools, the Resource Monitor can be a useful tool for diagnosing issues with a process.
The Resource Monitor contains CPU, Memory, Disk and Network tabs that will display all used resources that fall into those categories. Processes that have not performed I/O recently will not appear in the Disk or Network tabs.
You can drill down to a particular process (or processes) by selecting one via the checkbox to the left of the Process, in the "Processes" section. Alternatively, selecting the checkbox in the section's header will select all Processes in the list.
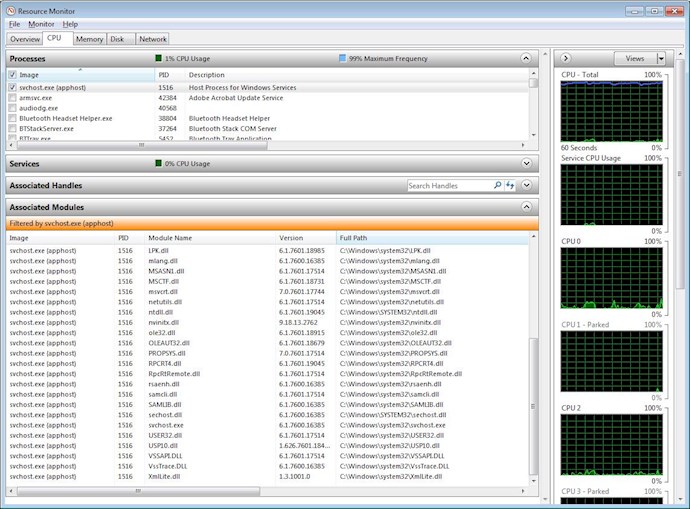
The monitor will remember the last 60 seconds of activity since the window was opened. If you are trying to get more detailed information about a small moment in time, you can pause the monitor. Pausing the Resource Monitor will prevent new information from being collected and old information from being discarded.
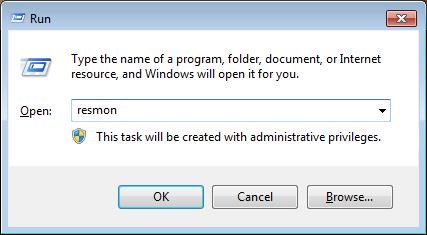
To access the Resource Monitor (resmon.exe), open up the Run window and enter resmon.
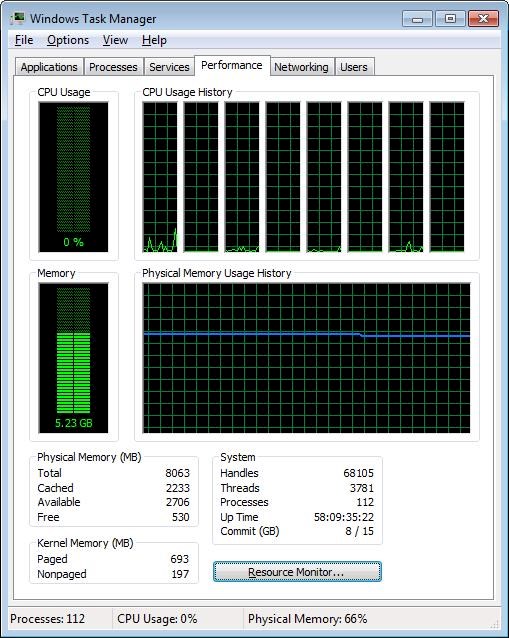
Alternatively, there is a "Resource Monitor' button in the "Performance" tab of the Task Manager.
The Resource Monitor is available on all machines running Windows 7 or greater.
